0%

【Sunflower】Dash应用程序实践(四)

分栏右侧显示卡

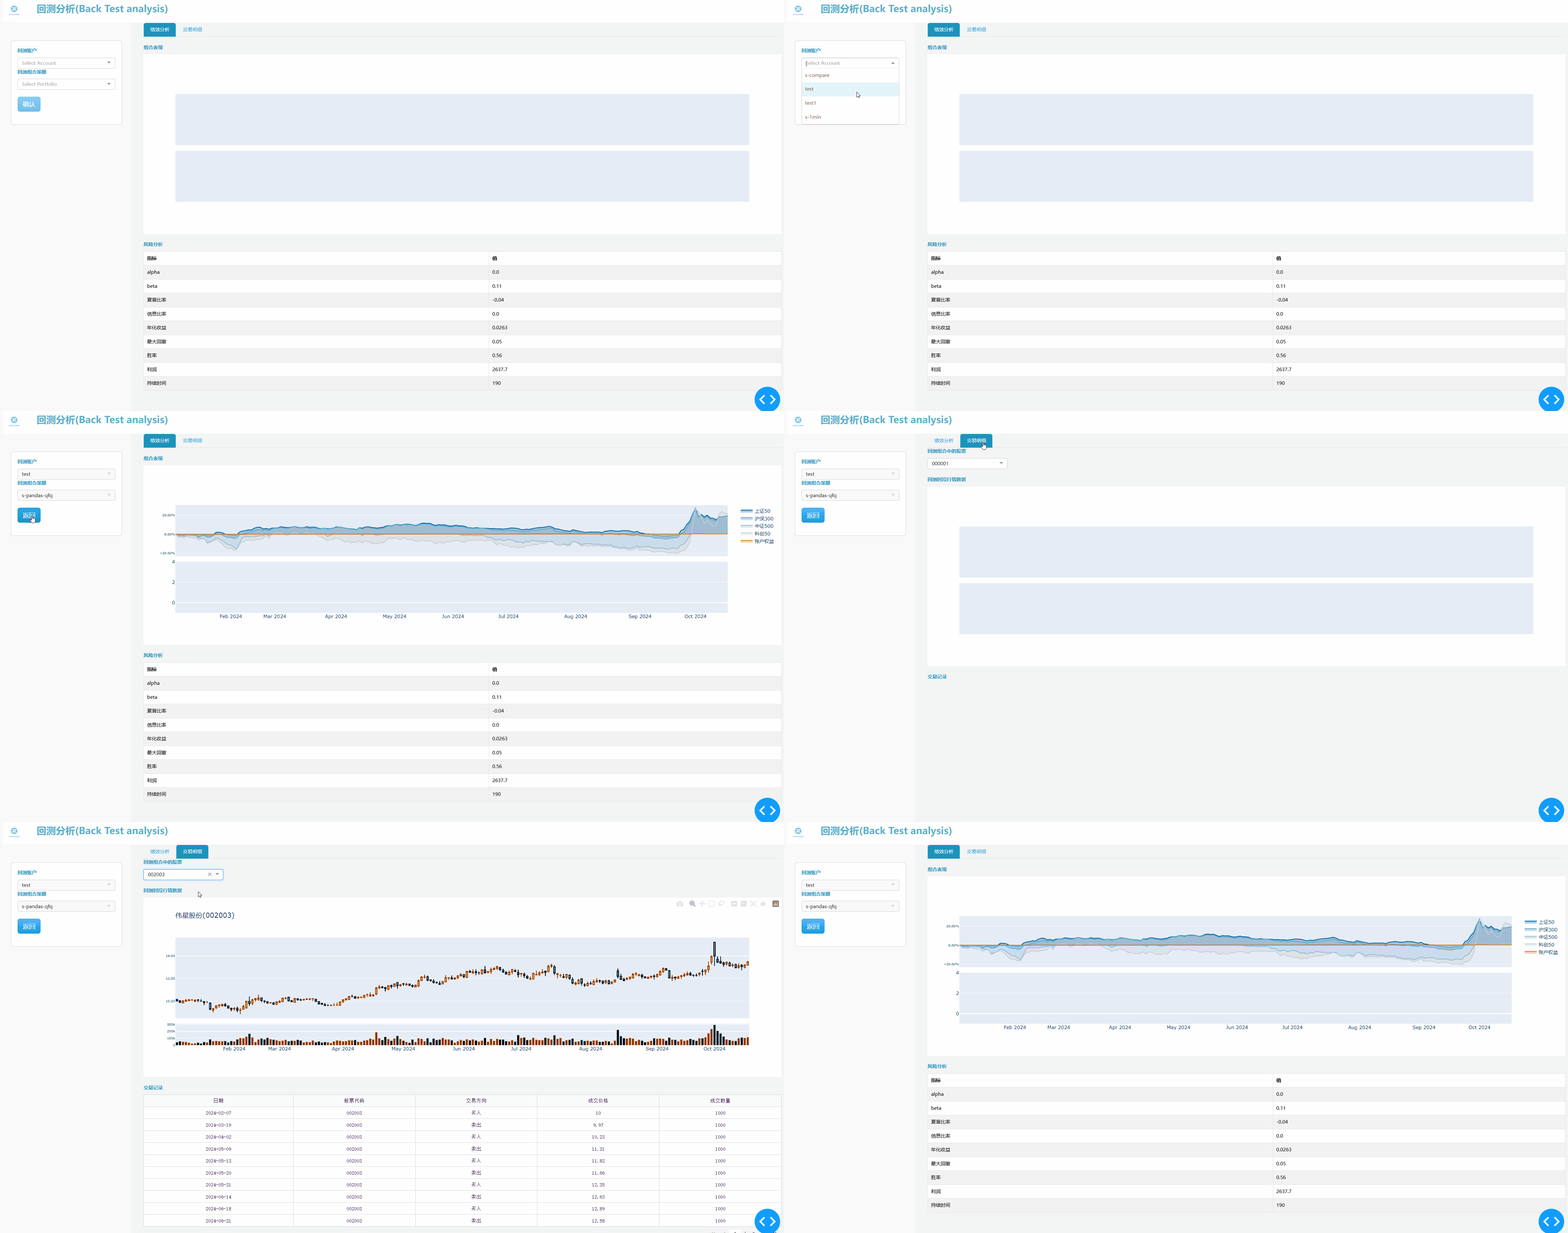
下面是分栏右侧的显示卡部分,使用 tabs 来分别展示“绩效分析”及“交易明细”。

绩效分析

1
2
3
4
5
6
7
8
9
10
11
12
13
14
15
16
17
18
19
20
21
22
23
24
25
26
27
28
29
30
31
32
33
34
35
36
37
38
39
40
41
42
43
44
45
46
47
48
49
50
51
52
53
def generate_display_tabs():
"""
:return: A Tab containing display graphs in right column
"""
tabs = html.Div(
[
dbc.Tabs(
[
dbc.Tab(label="绩效分析", tab_id="tab-summary"),
dbc.Tab(label="交易明细", tab_id="tab-details"),
],
id="tabs",
active_tab="tab-summary",
),
html.Div(id="tabs-content", children=generate_tab_summary_content()),
],
)
return tabs

def generate_tab_summary_content():
"""
:return: A Tab containing display graphs in right column
"""
df = pd.DataFrame(
{
"指标": ["alpha", "beta", "夏普比率", "信息比率", "年化收益", "最大回撤", "胜率", "利润", "持续时间"],
"值": ["0.0", "0.11", "-0.04", "0.0", "0.0263", "0.05", "0.56", "2637.7", "190"],
}
)

tab_summary_content = html.Div(
id="tab_summary_content",
children=[
html.Br(),
html.Div(
id="performance",
children=[
dbc.Label("组合表现"),
dcc.Graph(id="performance-chart", figure=initialize_performance_chart(),
)
],
),
html.Br(),
html.Div(
id="indicator",
children=[
dbc.Label("风险分析"),
dbc.Table.from_dataframe(df, striped=True, bordered=True, hover=True)
],
),
],
)
return tab_summary_content

这个代码段定义了一个用于生成金融分析展示界面的模块。它包括两个主要的功能:generate_display_tabsgenerate_tab_summary_content,分别用于生成一个包含多个标签页的布局,以及定义这些标签页的具体内容。以下是代码的详细解释:

generate_display_tabs() 函数

这个函数生成包含不同展示内容的标签页组件,并默认显示第一个标签页。

代码解析:

1
2
3
4
5
6
7
8
9
10
11
12
13
14
15
16
17
18
19
def generate_display_tabs():
"""
:return: A Tab containing display graphs in right column
"""
tabs = html.Div(
[
dbc.Tabs(
[
dbc.Tab(label="绩效分析", tab_id="tab-summary"),
dbc.Tab(label="交易明细", tab_id="tab-details"),
# dbc.Tab(label="其它", tab_id="tab-3"),
],
id="tabs",
active_tab="tab-summary",
),
html.Div(id="tabs-content", children=generate_tab_summary_content()),
],
)
return tabs
  1. dbc.Tabs: 创建一个标签页组件,用于显示不同的内容选项。它包含多个 dbc.Tab,每个标签页都有一个 labeltab_id

    • label="绩效分析": 标签页的显示名称。
    • tab_id="tab-summary": 标签页的唯一标识符。
  2. id="tabs": dbc.Tabs 组件的唯一标识符,便于在其他地方引用和操作。

  3. active_tab="tab-summary": 指定初始显示的标签页为“绩效分析”。

  4. html.Div(id="tabs-content", children=generate_tab_summary_content()): tabs-content 是一个用于容纳标签页内容的 Div 容器。初始内容由 generate_tab_summary_content() 函数生成。

generate_tab_summary_content() 函数

该函数用于生成“绩效分析”标签页的具体内容。它定义了一些图表和指标表格,用于展示组合表现和风险分析。

代码解析:

1
2
3
4
5
6
7
8
9
10
def generate_tab_summary_content():
"""
:return: A Tab containing display graphs in right column
"""
df = pd.DataFrame(
{
"指标": ["alpha", "beta", "夏普比率", "信息比率", "年化收益", "最大回撤", "胜率", "利润", "持续时间"],
"值": ["0.0", "0.11", "-0.04", "0.0", "0.0263", "0.05", "0.56", "2637.7", "190"],
}
)
  1. df = pd.DataFrame(...): 定义一个包含风险指标和相应数值的 DataFrame,用于创建风险分析的表格。后续会从回测分析中计算相应的 DataFrame。这里初始化主要用于展示。
    • 指标: 风险分析指标(如 Alpha、Beta、夏普比率等)。
    • : 每个指标对应的值。

子组件解释:

1
2
3
4
tab_summary_content = html.Div(
id="tab_summary_content",
children=[
html.Br(),
  1. html.Div(id="tab_summary_content", ...):容器 Div,包含多个显示子组件。
  2. html.Br(): 插入一个换行元素,为内容提供间隔。
(a) 组合表现(Graph 图表)
1
2
3
4
5
6
7
8
9
10
html.Div(
id="performance",
children=[
dbc.Label("组合表现"),
dcc.Graph(
id="performance-chart",
figure=initialize_performance_chart()
)
],
),
  1. id="performance": 定义了显示组合表现的 Div
  2. dbc.Label("组合表现"): 使用标签显示“组合表现”文本。
  3. dcc.Graph: 这是 Dash 中的图表组件,用于绘制组合表现图表。
    • id="performance-chart": 图表的唯一标识符。
    • figure=initialize_performance_chart(): 使用 initialize_performance_chart() 函数生成图表的数据。
(b) 风险分析(Table 表格)
1
2
3
4
5
6
7
html.Div(
id="indicator",
children=[
dbc.Label("风险分析"),
dbc.Table.from_dataframe(df, striped=True, bordered=True, hover=True)
],
),
  1. id="indicator": 定义了显示风险分析的 Div
  2. dbc.Label("风险分析"): 使用标签显示“风险分析”文本。
  3. dbc.Table.from_dataframe(df, ...): 从 DataFrame df 中生成表格,用于展示风险指标和其对应的值。
    • striped=True: 使用条纹样式。
    • bordered=True: 显示表格边框。
    • hover=True: 表格行在鼠标悬停时突出显示。

函数返回值

  • generate_display_tabs() 返回包含所有标签页的布局,用于放置在页面的右侧。
  • generate_tab_summary_content() 返回“绩效分析”标签页的内容,用于填充该标签页的展示内容。
1
2
3
4
5
6
7
8
9
10
11
12
13
14
15
16
17
18
19
20
21
22
23
24
25
26
27
28
29
30
31
32
33
34
35
36
37
38
39
40
41
42
43
44
45
46
47
48
49
50
51
52
53
54
55
56
57
58
59
60
61
62
63
64
65
66
67
68
69
70
71
72
73
74
75
76
77
78
79
80
def initialize_performance_chart():
"""
:return: A empty performance line chart.
"""

layout = dict(
title="",
hoversubplots="axis",
hovermode="closest",
grid=dict(rows=2, columns=1),
xaxis={"showticklabels": False},
xaxis2={"showticklabels": False},
yaxis={"visible": False},
yaxis2={"visible": False},
)

data = [go.Scatter(x=[], y=[], xaxis="x", yaxis="y", name="Asset vs. Benchmark"),
go.Bar(x=[], y=[], xaxis="x1", yaxis="y2", name="Monthly Profit")]


fig = go.Figure(data=data, layout=layout)
return fig

def generate_performance_chart(benchmark_data, asset_data):
"""
:return: A performance line chart.
"""
df_benchmark_data = pd.read_json(StringIO(benchmark_data), orient='split', dtype={"code": str, "date": str})
df = df_benchmark_data.copy()

# handle the date to form continous date(get rid of date without trade)
_dt_all = pd.date_range(start=df['date'].iloc[0], end=df['date'].iloc[-1])
dt_all = [d.strftime("%Y-%m-%d") for d in _dt_all]
trade_date = list(df['date'].values)
dt_breaks = list(set(dt_all) - set(trade_date))

#normalized index close price.
df_sz50 = df[df['code']=='000016'].copy()
df_sz50['normalized'] = df_sz50['close']/df_sz50['close'].iloc[0] - 1

df_hs300 = df[df['code']=='000300'].copy()
df_hs300['normalized'] = df_hs300['close']/df_hs300['close'].iloc[0] - 1

df_zz500 = df[df['code']=='000905'].copy()
df_zz500['normalized'] = df_zz500['close']/df_zz500['close'].iloc[0] - 1

df_kc50 = df[df['code']=='000688'].copy()
df_kc50['normalized'] = df_kc50['close']/df_kc50['close'].iloc[0] - 1

#normalized asset daily balance
dataset_asset = json.loads(asset_data)
asset_init_cash = dataset_asset.get('init_cash')
df_asset = pd.read_json(StringIO(dataset_asset['asset']), orient='split', dtype={"code": str, "date": str})
df_asset['normalized'] = df_asset['balance']/(asset_init_cash * 1.0) - 1


layout = dict(
title="",
hoversubplots="axis",
hovermode="x unified",
grid=dict(rows=2, columns=1),
)

data = [go.Scatter(x=df_sz50['date'], y=df_sz50['normalized'], xaxis="x", yaxis="y", name="上证50", line=dict(color='rgb(17,101,154)'), fill='tozeroy', fillcolor='rgba(17,101,154,0.3)'),
go.Scatter(x=df_hs300['date'], y=df_hs300['normalized'], xaxis="x", yaxis="y", name="沪深300", line=dict(color='rgb(97,154,195)'), fill='tozeroy', fillcolor='rgba(97,154,195,0.3)'),
go.Scatter(x=df_zz500['date'], y=df_zz500['normalized'], xaxis="x", yaxis="y", name="中证500", line=dict(color='rgb(147,181,207)'), fill='tozeroy', fillcolor='rgba(147,181,207,0.3)'),
go.Scatter(x=df_kc50['date'], y=df_kc50['normalized'], xaxis="x", yaxis="y", name="科创50", line=dict(color='rgb(186,204,217)'), fill='tozeroy', fillcolor='rgba(186,204,217,0.3)'),
go.Scatter(x=df_asset['date'], y=df_asset['normalized'], xaxis="x", yaxis="y", name="账户权益", line=dict(color='rgb(237,81,38)'), fill='tozeroy', fillcolor='rgba(237,81,38,0.3)'),
go.Bar(x=[], y=[], xaxis="x1", yaxis="y2", name="Monthly Profit")]


fig = go.Figure(data=data, layout=layout)
fig.update_layout(
xaxis_rangeslider_visible=False,
showlegend=True,
yaxis_tickformat=".2%",
)
fig.update_xaxes(rangebreaks=[dict(values=dt_breaks)])
fig.update_yaxes(hoverformat=".2%", tickfont_size=8)
return fig

这个代码段定义了两个函数:initialize_performance_chartgenerate_performance_chart。其中,initialize_performance_chart 用于初始化一个空的绩效图表,而 generate_performance_chart 则根据实际的基准和资产数据生成包含各类指标的图表。这两个图表显示了不同的指数(如上证 50、沪深 300 等)的表现,以及账户的整体权益趋势。

initialize_performance_chart() 函数

这个函数创建了一个空的、格式化的绩效图表,并返回 plotly.graph_objects.Figure 对象。

代码解析:

1
2
3
4
5
6
7
8
9
10
11
12
13
14
15
16
17
18
19
20
21
def initialize_performance_chart():
"""
:return: A empty performance line chart.
"""

layout = dict(
title="",
hoversubplots="axis",
hovermode="closest",
grid=dict(rows=2, columns=1),
xaxis={"showticklabels": False},
xaxis2={"showticklabels": False},
yaxis={"visible": False},
yaxis2={"visible": False},
)

data = [go.Scatter(x=[], y=[], xaxis="x", yaxis="y", name="Asset vs. Benchmark"),
go.Bar(x=[], y=[], xaxis="x1", yaxis="y2", name="Monthly Profit")]

fig = go.Figure(data=data, layout=layout)
return fig
  1. 布局配置 (layout):
    • title: 图表标题为空。
    • hoversubplots="axis": 设置悬停时的显示方式。
    • hovermode="closest": 设定鼠标悬停显示最接近的点。
    • grid=dict(rows=2, columns=1): 图表按 2 行 1 列布局。
    • xaxisxaxis2: 隐藏横坐标的标签。
    • yaxisyaxis2: 隐藏纵坐标轴。
  2. 图表数据 (data):
    • go.Scatter:用于创建资产与基准对比的折线图,但目前是空数据。
    • go.Bar:用于显示每月利润的柱状图,当前也为空数据。
  3. 生成图表:
    • fig = go.Figure(data=data, layout=layout): 使用上述配置生成图表。
    • 返回这个空图表,以便后续在没有数据时也能显示图表框架。

generate_performance_chart(benchmark_data, asset_data) 函数

这个函数生成包含不同基准指数与账户权益的图表。数据通过基准和账户的数据传入,函数会处理和标准化它们的表现,并将它们绘制在图表上。

代码解析:

1
2
3
4
5
6
7
8
9
10
11
12
def generate_performance_chart(benchmark_data, asset_data):
"""
:return: A performance line chart.
"""
df_benchmark_data = pd.read_json(StringIO(benchmark_data), orient='split', dtype={"code": str, "date": str})
df = df_benchmark_data.copy()

# handle the date to form continuous date(get rid of date without trade)
_dt_all = pd.date_range(start=df['date'].iloc[0], end=df['date'].iloc[-1])
dt_all = [d.strftime("%Y-%m-%d") for d in _dt_all]
trade_date = list(df['date'].values)
dt_breaks = list(set(dt_all) - set(trade_date))
  1. 数据准备
    • pd.read_json:将 JSON 格式的基准数据读取为 DataFrame
    • pd.date_range:生成从起始到结束日期的连续日期。
    • dt_breaks:计算非交易日(即 dt_alltrade_date 的差集),用于图表中日期的断开处理。
1
2
3
4
#normalized index close price.
df_sz50 = df[df['code']=='000016'].copy()
df_sz50['normalized'] = df_sz50['close']/df_sz50['close'].iloc[0] - 1
...
  1. 基准指数标准化
    • 依次筛选上证 50(000016)、沪深 300(000300)、中证 500(000905)、科创 50(000688)的数据并生成副本。
    • normalized:将每个指数的每日收盘价标准化,计算出相对于第一天的百分比变化,用于统一显示不同指数的表现。
1
2
3
4
dataset_asset = json.loads(asset_data)
asset_init_cash = dataset_asset.get('init_cash')
df_asset = pd.read_json(StringIO(dataset_asset['asset']), orient='split', dtype={"code": str, "date": str})
df_asset['normalized'] = df_asset['balance']/(asset_init_cash * 1.0) - 1
  1. 账户资产标准化
    • 读取资产数据,获取初始现金。
    • 将每日资产权益标准化为百分比变化,以便与基准指数的变化进行比较。

图表布局和数据

1
2
3
4
5
6
7
8
9
10
11
layout = dict(
title="",
hoversubplots="axis",
hovermode="x unified",
grid=dict(rows=2, columns=1),
)

data = [go.Scatter(x=df_sz50['date'], y=df_sz50['normalized'], xaxis="x", yaxis="y", name="上证50", line=dict(color='rgb(17,101,154)'), fill='tozeroy', fillcolor='rgba(17,101,154,0.3)'),
...
go.Scatter(x=df_asset['date'], y=df_asset['normalized'], xaxis="x", yaxis="y", name="账户权益", line=dict(color='rgb(237,81,38)'), fill='tozeroy', fillcolor='rgba(237,81,38,0.3)'),
go.Bar(x=[], y=[], xaxis="x1", yaxis="y2", name="Monthly Profit")]
  1. 布局定义
    • hovermode="x unified": 横坐标悬停模式。
    • grid=dict(rows=2, columns=1): 图表布局为 2 行 1 列。
  2. 图表数据
    • go.Scatter: 用于绘制每个基准指数和账户权益的标准化折线图,填充色指定透明度和颜色。
    • go.Bar: 占位柱状图(目前为空数据),用于日后显示月度利润。

生成并返回图表

1
2
3
4
5
6
7
8
9
fig = go.Figure(data=data, layout=layout)
fig.update_layout(
xaxis_rangeslider_visible=False,
showlegend=True,
yaxis_tickformat=".2%",
)
fig.update_xaxes(rangebreaks=[dict(values=dt_breaks)])
fig.update_yaxes(hoverformat=".2%", tickfont_size=8)
return fig
  • fig.update_layout(...): 设置图表的整体布局,包括隐藏日期范围滑块、显示图例等。
  • fig.update_xaxes(rangebreaks=[dict(values=dt_breaks)]): 设置日期轴,跳过非交易日。
  • fig.update_yaxes(...): 设置纵轴的格式,以百分比显示数据。

返回的 fig 是一个包含多个指数与账户资产表现的对比图表,用于在图形界面上展示各项数据的走势。

交易明细

1
2
3
4
5
6
7
8
9
10
11
12
13
14
15
16
17
18
19
20
21
22
23
24
25
26
27
28
29
30
31
32
33
34
35
36
37
38
39
40
41
42
43
44
45
46
47
48
49
50
51
52
53
54
55
56
57
58
59
60
61
62
63
64
65
66
67
68
69
70
71
72
73
74
75
76
77
78
79
80
81
82
83
84
85
86
87
88
89
90
91
92
93
94
95
96
97
98
99
100
101
102
103
104
105
106
107
108
109
110
111
112
113
114
115
116
117
118
119
120
121
122
123
124
125
126
127
128
129
130
131
132
133
134
135
136
137
138
def generate_tab_details_content():
"""
:return: A Tab containing display graphs in right column
"""
tab_details_content = html.Div(
id="tab_details_content",
#className="eleven columns",
children=[
#html.Br(),
html.Div(
id="stock_list",
children=[
dbc.Label("回测组合中的股票"),
dcc.Dropdown(
id="security-select",
options = [],
placeholder="Select the security",
style={"width":"200px"},
),
html.Br()
],
),
# Stock candle chart
html.Div(
id="stock-candle-chart-card",
children=[
dbc.Label("回测时段行情数据"),
#html.Hr(),
dcc.Graph(id="stock-candle-chart", figure=initialize_stock_candle_chart())
],
),
html.Br(),
# trade records
html.Div(
id="trade_records",
children=[
dbc.Label("交易记录"),
#html.Hr(),
dash_table.DataTable(id='current-stock-trade-history', columns=initialize_data_table(), page_size= 10, style_cell={'textAlign': 'center'})
],
),
],
)
return tab_details_content

def initialize_stock_candle_chart():
"""
:return: A empty stock candle chart.
"""
df = pd.DataFrame(columns=['date', 'open', 'high', 'low', 'close', 'vol'])
layout = dict(
title="",
hoversubplots="axis",
hovermode="x unified",
grid=dict(rows=2, columns=1),
xaxis={"showticklabels": False},
yaxis={"visible": False},
yaxis2={"visible": False},
)

data = [go.Candlestick(x=df["date"], open=df['open'], high=df['high'], low=df['low'], close=df['close'],
xaxis="x", yaxis="y", increasing_line_color='red', decreasing_line_color='green', name=""),
go.Bar(x=df['date'], y=df['vol'], xaxis="x", yaxis="y2", name="volume")]


fig = go.Figure(data=data, layout=layout)
return fig

def generate_stock_candle_chart(data, code):
"""
:return: A stock candle chart.
"""
df_pandas = pd.read_json(StringIO(data), orient='split', dtype={"date": str, "code": str})
df = df_pandas.copy()
print(df)

# handle the date to form continous date(get rid of date without trade)
_dt_all = pd.date_range(start=df['date'].iloc[0], end=df['date'].iloc[-1])
dt_all = [d.strftime("%Y-%m-%d") for d in _dt_all]
trade_date = list(df['date'].values)
dt_breaks = list(set(dt_all) - set(trade_date))

# handle volume color to use the same color with candlestick
df['bar_color'] = np.where(
df['close'] - df['open'] >= 0, 'red', 'green')

df=df.loc[df['code']==code]

# use plotly to plot
## define layout & data
layout = dict(
title= f"{fetch_stock_name(code)}({code})",
hoversubplots="axis",
hovermode="x unified",
grid=dict(rows=2, columns=1),
yaxis=dict(domain=[0.25, 1]),
yaxis2=dict(domain=[0, 0.20]),
)

data = [
go.Candlestick(x=df["date"], open=df['open'], high=df['high'], low=df['low'], close=df['close'],
xaxis="x", yaxis="y", increasing_line_color='red', decreasing_line_color='green', name="",

),
go.Bar(x=df['date'], y=df['vol'], xaxis="x", yaxis="y2",
marker_color=df['bar_color'], name="volume")
]

## custom the layout
## define hoverlabel background color/font
## plot without rangeslider
fig = go.Figure(data=data, layout=layout)
fig.update_xaxes(rangebreaks=[dict(values=dt_breaks)])
fig.update_layout(
hoverlabel=dict(
bgcolor="white",
font_size=12,
font_family="Rockwell",
),
xaxis_rangeslider_visible=False,
showlegend=False,
yaxis_tickformat=".2f",
)
fig.update_yaxes(hoverformat=".2f", tickfont_size=8)
return fig

def initialize_data_table():
"""
:return: data table columns.
"""
columns=[
{'name': '日期', 'id': '日期'},
{'name': '股票代码', 'id': '股票代码'},
{'name': '交易方向', 'id': '交易方向'},
{'name': '成交价格', 'id': '成交价格'},
{'name': '成交数量', 'id': '成交数量'}
]
return columns

这个代码片段创建了一个包含股票回测分析界面的 Dash 应用程序。该应用分为多个部分,如股票选择、K 线图、交易记录表等。各部分展示了用户在回测时段中的持仓股票、股价行情、交易记录等信息。

generate_tab_details_content 函数

generate_tab_details_content 函数创建了一个 "交易明细" 标签页的内容,包括股票选择、K 线图和交易记录表。

代码解析:

1
2
3
4
5
6
7
8
9
10
11
12
13
14
15
16
17
18
19
20
21
22
23
24
25
26
27
28
29
30
31
32
33
34
35
36
37
38
39
40
41
def generate_tab_details_content():
"""
:return: A Tab containing display graphs in right column
"""
tab_details_content = html.Div(
id="tab_details_content",
children=[
# 股票选择下拉菜单
html.Div(
id="stock_list",
children=[
dbc.Label("回测组合中的股票"),
dcc.Dropdown(
id="security-select",
options=[],
placeholder="Select the security",
style={"width":"200px"},
),
html.Br()
],
),
# 股票行情 K 线图
html.Div(
id="stock-candle-chart-card",
children=[
dbc.Label("回测时段行情数据"),
dcc.Graph(id="stock-candle-chart", figure=initialize_stock_candle_chart())
],
),
html.Br(),
# 交易记录表格
html.Div(
id="trade_records",
children=[
dbc.Label("交易记录"),
dash_table.DataTable(id='current-stock-trade-history', columns=initialize_data_table(), page_size=10, style_cell={'textAlign': 'center'})
],
),
],
)
return tab_details_content
  1. security-select: 创建股票选择的下拉菜单组件。
  2. stock-candle-chart: 使用 initialize_stock_candle_chart 生成一个空的 K 线图,用于展示所选股票的历史行情数据。
  3. current-stock-trade-history: 使用 initialize_data_table 设置列信息,用于显示股票的交易记录。

initialize_stock_candle_chart 函数

这个函数生成一个空的 K 线图,为股票交易数据展示提供图表结构。

1
2
3
4
5
6
7
8
9
10
11
12
13
14
15
16
17
18
19
20
21
def initialize_stock_candle_chart():
"""
:return: A empty stock candle chart.
"""
df = pd.DataFrame(columns=['date', 'open', 'high', 'low', 'close', 'vol'])
layout = dict(
title="",
hoversubplots="axis",
hovermode="x unified",
grid=dict(rows=2, columns=1),
xaxis={"showticklabels": False},
yaxis={"visible": False},
yaxis2={"visible": False},
)

data = [go.Candlestick(x=df["date"], open=df['open'], high=df['high'], low=df['low'], close=df['close'],
xaxis="x", yaxis="y", increasing_line_color='red', decreasing_line_color='green', name=""),
go.Bar(x=df['date'], y=df['vol'], xaxis="x", yaxis="y2", name="volume")]

fig = go.Figure(data=data, layout=layout)
return fig
  • 布局:布局指定图表显示样式,包括隐藏轴标签,设置多图层布局。
  • 数据格式:使用空数据集初始化一个 K 线图和成交量柱状图的结构,使用 Plotly 生成图形对象 fig

generate_stock_candle_chart 函数

generate_stock_candle_chart 函数根据数据生成实际的股票 K 线图,显示特定股票的行情数据。

1
2
3
4
5
6
7
8
9
10
11
12
13
14
15
16
17
18
19
20
21
22
23
24
25
26
27
28
29
30
31
32
33
34
35
36
37
38
39
40
41
42
43
44
45
46
47
48
49
50
def generate_stock_candle_chart(data, code):
"""
:return: A stock candle chart.
"""
df_pandas = pd.read_json(StringIO(data), orient='split', dtype={"date": str, "code": str})
df = df_pandas.copy()

# 计算交易日缺口
_dt_all = pd.date_range(start=df['date'].iloc[0], end=df['date'].iloc[-1])
dt_all = [d.strftime("%Y-%m-%d") for d in _dt_all]
trade_date = list(df['date'].values)
dt_breaks = list(set(dt_all) - set(trade_date))

# 设置成交量颜色
df['bar_color'] = np.where(df['close'] - df['open'] >= 0, 'red', 'green')

# 过滤指定股票代码
df = df.loc[df['code'] == code]

# 布局与数据设置
layout = dict(
title=f"{fetch_stock_name(code)}({code})",
hoversubplots="axis",
hovermode="x unified",
grid=dict(rows=2, columns=1),
yaxis=dict(domain=[0.25, 1]),
yaxis2=dict(domain=[0, 0.20]),
)

data = [
go.Candlestick(x=df["date"], open=df['open'], high=df['high'], low=df['low'], close=df['close'],
xaxis="x", yaxis="y", increasing_line_color='red', decreasing_line_color='green', name=""),
go.Bar(x=df['date'], y=df['vol'], xaxis="x", yaxis="y2",
marker_color=df['bar_color'], name="volume")
]

fig = go.Figure(data=data, layout=layout)
fig.update_xaxes(rangebreaks=[dict(values=dt_breaks)])
fig.update_layout(
hoverlabel=dict(
bgcolor="white",
font_size=12,
font_family="Rockwell",
),
xaxis_rangeslider_visible=False,
showlegend=False,
yaxis_tickformat=".2f",
)
fig.update_yaxes(hoverformat=".2f", tickfont_size=8)
return fig
  1. 数据准备:读取数据并处理日期,将非交易日移除。
  2. 布局配置:设置图表标题、图例、标签格式、颜色等,以便图表更具可读性。
  3. 数据展示:生成 K 线图和成交量柱状图,颜色区分涨跌,rangebreaks 跳过非交易日。

initialize_data_table 函数

initialize_data_table 函数设置 DataTable 的列信息,用于显示股票交易的明细信息。

1
2
3
4
5
6
7
8
9
10
11
12
def initialize_data_table():
"""
:return: data table columns.
"""
columns = [
{'name': '日期', 'id': '日期'},
{'name': '股票代码', 'id': '股票代码'},
{'name': '交易方向', 'id': '交易方向'},
{'name': '成交价格', 'id': '成交价格'},
{'name': '成交数量', 'id': '成交数量'}
]
return columns
  • 返回列的字典列表,定义了 DataTable 中每列的标题和数据 ID。

通过这些函数和布局结构,应用提供了股票的回测分析功能,包括 K 线图、成交量柱状图、交易记录等视图。

回调函数

1
2
3
4
5
6
7
8
9
10
11
12
13
14
15
16
17
18
19
20
21
22
23
24
25
26
27
28
29
30
31
32
33
34
35
36
37
38
39
40
41
42
43
44
45
46
47
48
49
50
51
52
53
54
55
56
57
58
59
60
61
62
63
64
65
66
67
68
69
70
71
# output tab content based on active tab and data in localstore
@app.callback(
Output("tabs-content", "children"),
Input("tabs", "active_tab"),
prevent_initial_call=True,
)
def init_tab(active_tab):
if active_tab == 'tab-details':
return generate_tab_details_content()
elif active_tab == 'tab-summary':
return generate_tab_summary_content()
# output performance chart when active tab is 'tab-summary', if use 'prevent_initial_call=True', the callback will not be triggered
@app.callback(
Output("performance-chart", "figure"),
Input("benchmark-day", "data"),
Input("asset", "data"),
Input("tabs", "active_tab"),
#prevent_initial_call=True
)
def update_performance_chart(benchmark_data, asset_data, active_tab):
if active_tab == 'tab-summary' and benchmark_data and asset_data:
return generate_performance_chart(benchmark_data, asset_data)
else:
return no_update


@app.callback(
Output("security-select", "options"),
Output("security-select", "value"),
Input("account-trade-history", "data"),
Input("tabs", "active_tab"),
#prevent_initial_call=True,
)
def output_code_selector(data, active_tab):
if active_tab == 'tab-details' and data:
df = pd.read_json(StringIO(data), orient='split', dtype={"股票代码": str})
stock_list = df['股票代码'].unique().tolist()
return stock_list, stock_list[0]
else:
return no_update


@app.callback(
Output("current-stock-trade-history", "data"),
Input("account-trade-history", "data"),
Input("security-select", "value"),
Input("tabs", "active_tab"),
prevent_initial_call=True
)
def update_current_trade_history_table(data, code, active_tab):
if active_tab == 'tab-details':
df = pd.read_json(StringIO(data), orient='split', dtype={"股票代码": str})
df_tmp = df.loc[df['股票代码']==code].reset_index()
data_table = df_tmp.to_dict('records')
return data_table
else:
return no_update

@app.callback(
Output("stock-candle-chart", "figure"),
Input("stock-day", "data"),
Input("security-select", "value"),
Input("tabs", "active_tab"),
prevent_initial_call=True
)
def update_candle_stick_chart(data, code, active_tab):
if active_tab == 'tab-details':
return generate_stock_candle_chart(data, code)
else:
return no_update

这个代码片段通过 Dash 回调函数实现了一个多标签页的应用,展示了股票的相关数据分析。它包含五个主要回调函数,分别用于显示标签页内容、更新绩效图表、更新股票选择下拉菜单、更新交易记录表格以及更新 K 线图。每个回调函数通过 active_tab 输入来控制在不同标签页下显示不同的内容。

init_tab 回调函数

该函数根据当前激活的标签页决定显示的内容:

1
2
3
4
5
6
7
8
9
10
@app.callback(
Output("tabs-content", "children"),
Input("tabs", "active_tab"),
prevent_initial_call=True,
)
def init_tab(active_tab):
if active_tab == 'tab-details':
return generate_tab_details_content()
elif active_tab == 'tab-summary':
return generate_tab_summary_content()
  • 功能:当用户切换到 tab-details 时显示“交易明细”内容,切换到 tab-summary 时显示“绩效分析”内容。
  • 参数
    • active_tab:当前选中的标签。
    • prevent_initial_call=True:回调不会在应用首次加载时触发,仅在用户操作(切换标签)时触发。

update_performance_chart 回调函数

该回调在切换到绩效分析页且存在基准和资产数据时生成绩效图表:

1
2
3
4
5
6
7
8
9
10
11
@app.callback(
Output("performance-chart", "figure"),
Input("benchmark-day", "data"),
Input("asset", "data"),
Input("tabs", "active_tab"),
)
def update_performance_chart(benchmark_data, asset_data, active_tab):
if active_tab == 'tab-summary' and benchmark_data and asset_data:
return generate_performance_chart(benchmark_data, asset_data)
else:
return no_update
  • 功能:在 tab-summary 标签页选中并且 benchmark-dayasset 数据不为空时,调用 generate_performance_chart 生成绩效图表。
  • 返回值:如果条件不满足,则返回 no_update,图表保持不变。

output_code_selector 回调函数

此回调为 security-select 下拉菜单提供选项:

1
2
3
4
5
6
7
8
9
10
11
12
13
@app.callback(
Output("security-select", "options"),
Output("security-select", "value"),
Input("account-trade-history", "data"),
Input("tabs", "active_tab"),
)
def output_code_selector(data, active_tab):
if active_tab == 'tab-details' and data:
df = pd.read_json(StringIO(data), orient='split', dtype={"股票代码": str})
stock_list = df['股票代码'].unique().tolist()
return stock_list, stock_list[0]
else:
return no_update
  • 功能:当用户在 tab-details 页面中时,根据 account-trade-history 数据设置 security-select 下拉菜单的选项。
  • 参数
    • account-trade-history:包含交易记录数据的 dcc.Store 数据。
    • 返回值:股票列表和默认选中的股票代码。若条件不满足则返回 no_update

update_current_trade_history_table 回调函数

此回调函数更新 current-stock-trade-history 表格内容:

1
2
3
4
5
6
7
8
9
10
11
12
13
14
15
@app.callback(
Output("current-stock-trade-history", "data"),
Input("account-trade-history", "data"),
Input("security-select", "value"),
Input("tabs", "active_tab"),
prevent_initial_call=True
)
def update_current_trade_history_table(data, code, active_tab):
if active_tab == 'tab-details':
df = pd.read_json(StringIO(data), orient='split', dtype={"股票代码": str})
df_tmp = df.loc[df['股票代码']==code].reset_index()
data_table = df_tmp.to_dict('records')
return data_table
else:
return no_update
  • 功能:当用户切换到 tab-details 页面时,通过 security-select 选中的股票代码过滤交易记录数据,并显示该股票的交易记录。
  • 参数
    • account-trade-history:包含全部交易数据。
    • security-select:当前选中的股票代码。
    • 返回值:过滤后的交易记录,以字典列表的格式返回给 current-stock-trade-history 表格。

update_candle_stick_chart 回调函数

该函数更新股票的 K 线图,显示选中股票的日 K 线数据:

1
2
3
4
5
6
7
8
9
10
11
12
@app.callback(
Output("stock-candle-chart", "figure"),
Input("stock-day", "data"),
Input("security-select", "value"),
Input("tabs", "active_tab"),
prevent_initial_call=True
)
def update_candle_stick_chart(data, code, active_tab):
if active_tab == 'tab-details':
return generate_stock_candle_chart(data, code)
else:
return no_update
  • 功能:在 tab-details 标签页选中时,读取 stock-day 数据生成股票的 K 线图。
  • 参数
    • stock-day:包含日 K 线数据的 dcc.Store 数据。
    • security-select:用户选中的股票代码,用于从 stock-day 中筛选数据。
  • 返回值:返回生成的 K 线图图表对象,若条件不满足则返回 no_update

总结

这个代码片段通过多个回调实现了多标签页数据展示功能: - init_tab 控制标签页内容。 - update_performance_chartupdate_candle_stick_chart 根据选中的标签页动态更新图表。 - output_code_selectorupdate_current_trade_history_table 在“交易明细”页面动态生成股票选择和交易记录表格内容。

效果展示